The 54-Tool Connascence MCP Server
I published a code quality analyzer with 54 MCP tools, 14 agent access profiles, and zero configuration. It runs inside your AI session and finds coupling patterns your linter never will.
I published a code quality analyzer with 54 MCP tools, 14 agent access profiles, and zero configuration required. It runs inside your AI session.
Most MCP servers expose 3-5 tools. Maybe 10 if they’re ambitious. Mine has 54 because code quality analysis isn’t one thing — it’s a dozen different lenses on the same codebase, and each lens needs its own interface.
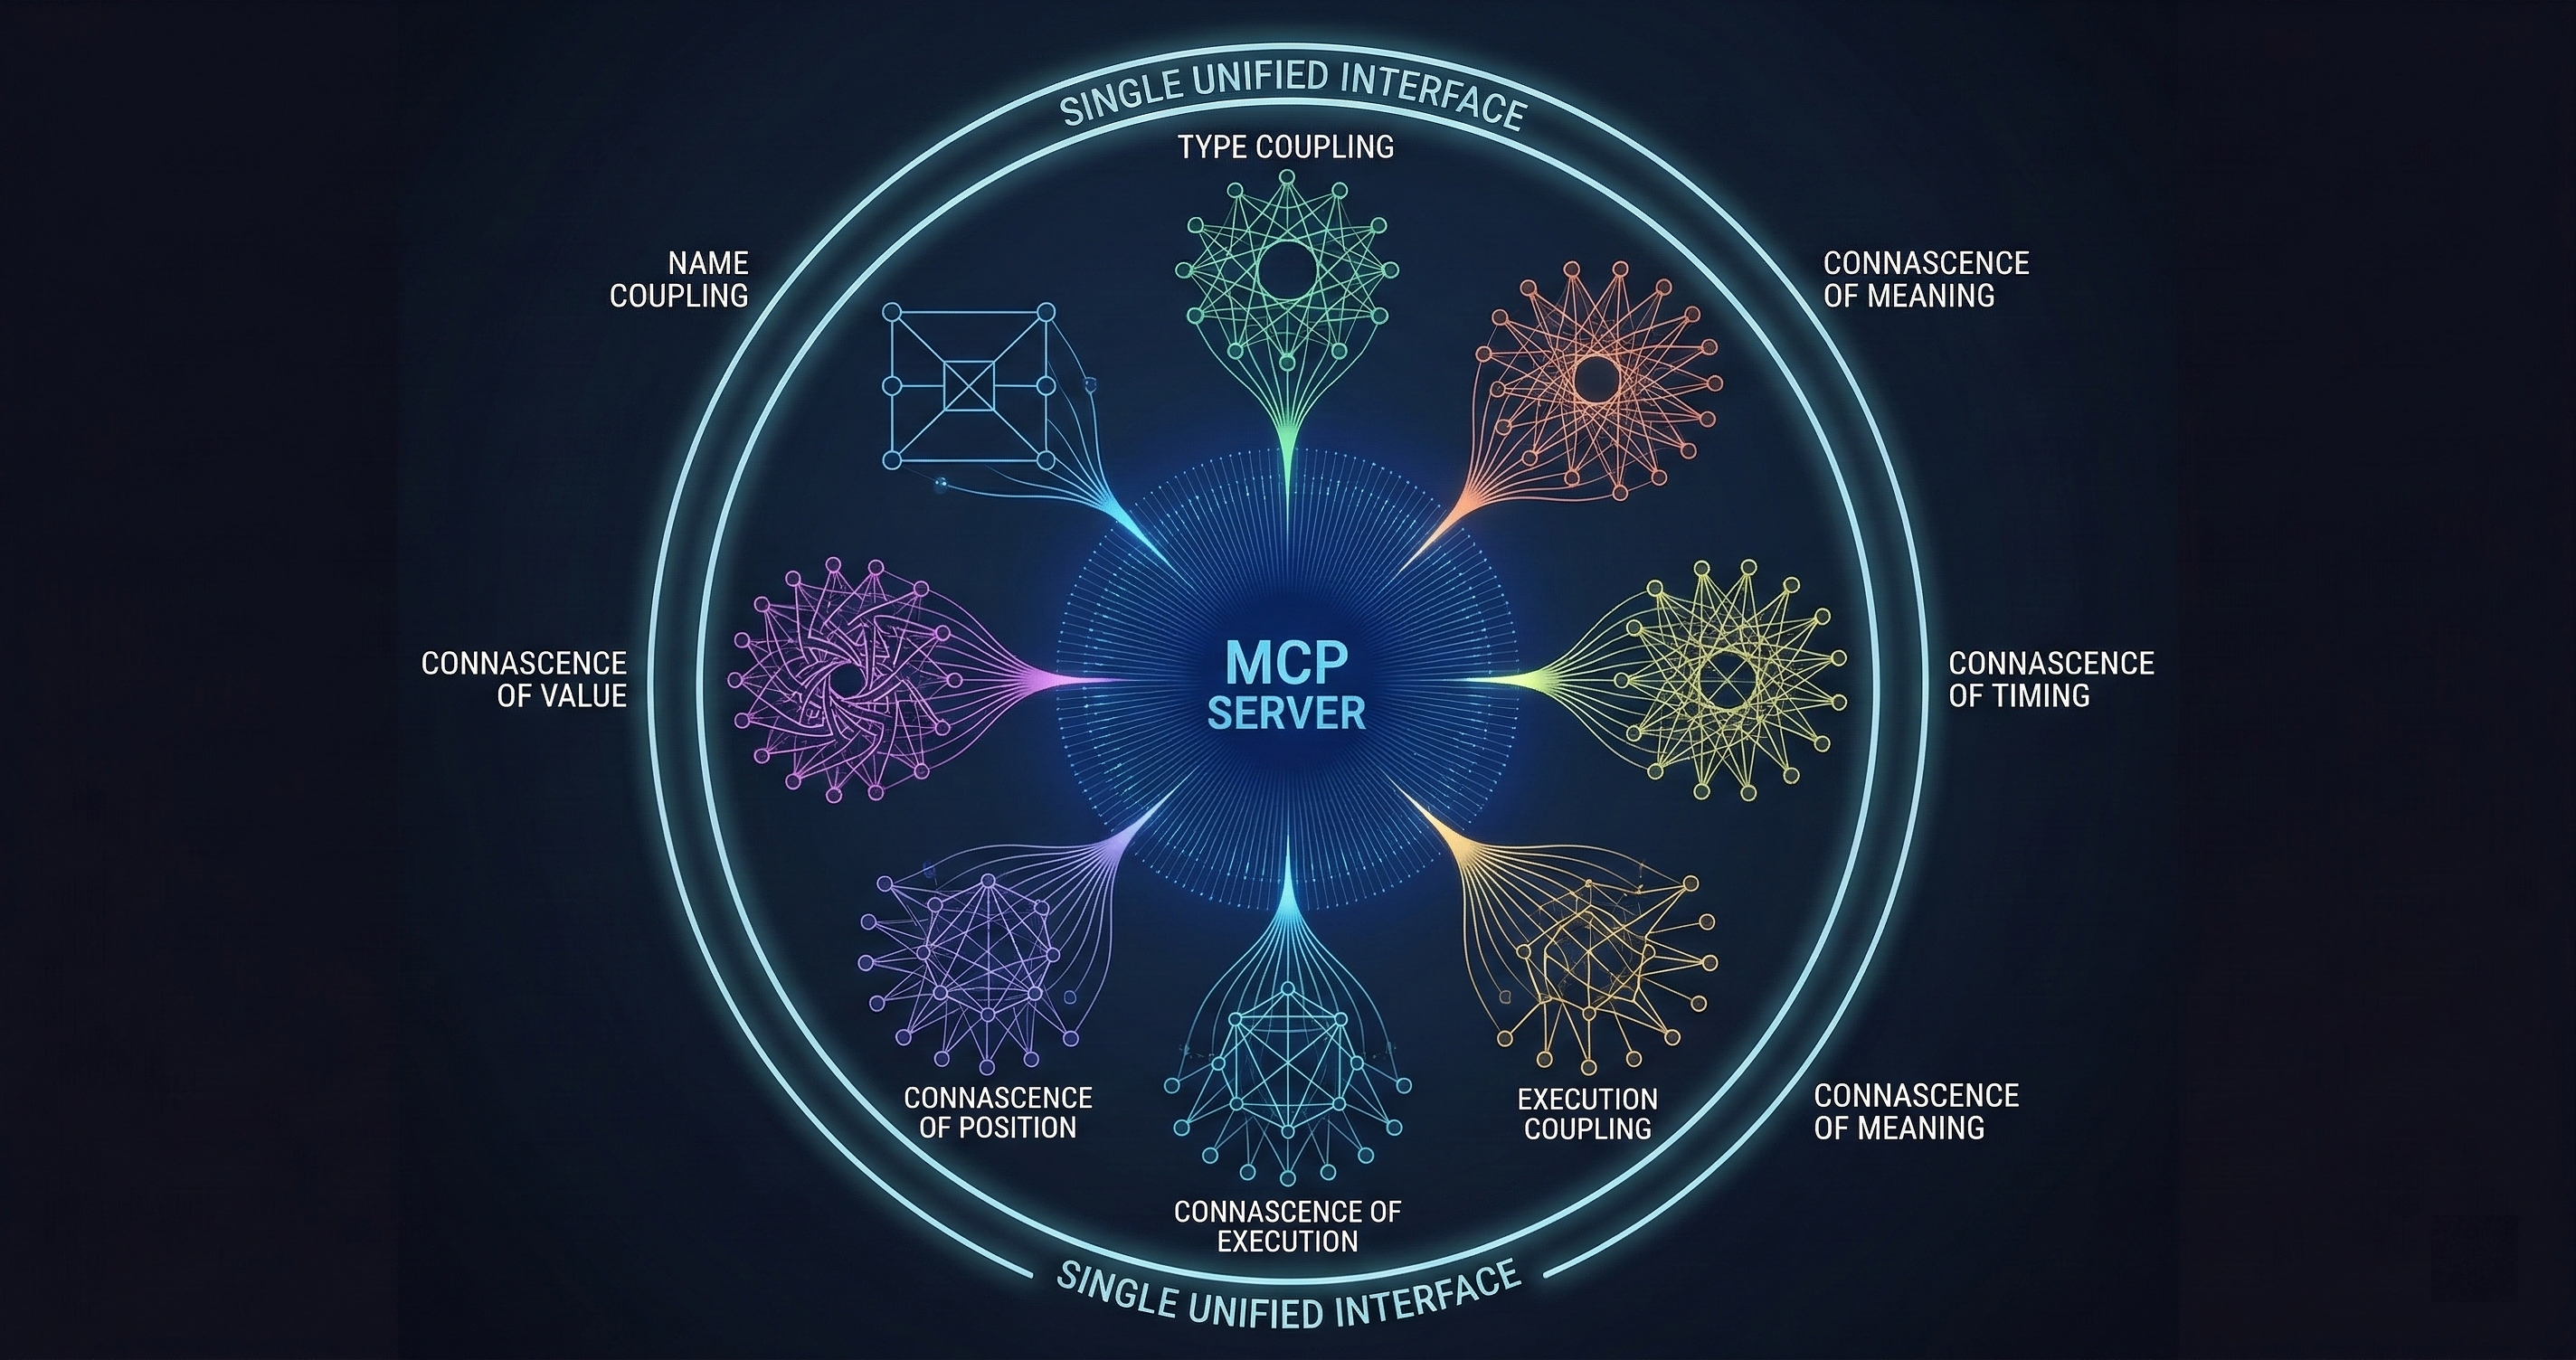
The server is the MCP face of my connascence analyzer, which I’ve written about before. Connascence is a taxonomy of code coupling that’s more specific and more useful than the word “coupling” alone. Instead of saying “these modules are coupled,” connascence tells you exactly how: by name, by type, by meaning, by algorithm, by position, by timing, by value, by identity, or by execution order. Each type has different costs and different fixes.
The MCP server puts all of that analysis inside your AI assistant’s toolbox.
The Tool Catalog
Fifty-four tools is a lot. Here’s how they break down.
Core Analysis Tools (12)
These are the workhorses. They analyze source code and return structured reports about coupling patterns.
analyze_file runs the full connascence analysis on a single file. It detects all nine types of connascence, scores them by severity, and returns a structured report with line numbers, descriptions, and suggested fixes.
analyze_directory does the same across an entire directory tree. This is what you run when you want a codebase-wide picture. On a 50K-line Python project, it completes in under 30 seconds and typically finds 200-500 coupling instances.
analyze_diff is my favorite. It analyzes only the changed lines in a git diff. This is what you’d integrate into a code review workflow — don’t audit the whole codebase, just check whether the new code introduces coupling problems. Feed it a PR diff and it tells you exactly what coupling patterns the change introduces or resolves.
detect_type runs detection for a specific connascence type. If you know you’re looking for Connascence of Meaning (magic numbers), you can skip the other eight detectors and get a focused report.
score_module computes a numerical coupling score for a module based on the number, type, and severity of connascence instances. This gives you a single metric to track over time.
compare_snapshots takes two analysis snapshots and shows you what changed. Run it before and after a refactoring to prove the refactoring actually reduced coupling. Numbers, not feelings.
The remaining six core tools handle file filtering, output formatting, incremental analysis, and batch processing for CI/CD integration.
Policy and Compliance Tools (9)
This is where the analyzer stops being a suggestion engine and starts being an enforcement mechanism.
set_policy defines quality thresholds. “No module may have more than 3 instances of Connascence of Meaning” or “Connascence of Identity score must be below 15 per file.” Policies are expressed as rules with severity levels.
check_compliance runs the current codebase against your policy set and returns pass/fail with details on every violation. This is what you’d wire into a CI gate.
generate_sarif exports results in SARIF format — the Static Analysis Results Interchange Format that GitHub, Azure DevOps, and other platforms understand natively. Upload the SARIF file and your coupling violations appear as code annotations directly in pull request reviews.
policy_from_baseline is pragmatic. It analyzes your current codebase, measures existing coupling levels, and generates a policy that accepts your current state but prevents regression. You’re not fixing legacy code overnight. You’re drawing a line and saying “no worse than this.”
audit_trail records every policy check with timestamps, results, and the code state that was analyzed. When someone asks “was this module reviewed for coupling before it shipped?” you have the receipts.
The remaining four tools handle policy versioning, exception management, threshold tuning, and compliance reporting across multi-repo setups.
Quality Metrics Tools (7)
Coupling analysis produces data. These tools turn data into decisions.
trend_report shows coupling metrics over time. Are you getting better or worse? Which modules are improving and which are degrading? This answers the question every engineering manager asks: “is our code quality improving?”
hotspot_map identifies the modules with the highest coupling density. These are your refactoring targets — the files where a focused cleanup would have the most impact.
coupling_graph generates a dependency graph weighted by connascence type and strength. Stronger coupling types get thicker edges. The resulting visualization immediately shows you where the dangerous dependencies live.
risk_score combines coupling metrics with change frequency data. A tightly coupled module that changes every sprint is a higher risk than a tightly coupled module that hasn’t been touched in a year. This tool helps you prioritize where to invest refactoring effort.
benchmark compares your project’s coupling metrics against aggregate data from other projects analyzed with the same tool. Are you above or below average? Which coupling types are you particularly bad at?
The remaining two tools handle metric export and dashboard integration.
Integration Tools (12)
These connect the analyzer to your development workflow.
github_check posts results as GitHub check runs. pr_comment generates formatted review comments with line-level findings. ci_gate returns pass/fail exit codes for pipeline integration. ide_diagnostics formats results as LSP-compatible inline warnings. slack_notify sends coupling reports to a channel for team visibility. webhook sends structured results to arbitrary HTTP endpoints.
The remaining six handle Jira integration, GitLab CI compatibility, notification templates, result caching, webhook auth, and retry logic.
Agent Access Control (14 profiles)
This is the part that most MCP servers skip entirely.
Not every AI agent should have access to every tool. A code review agent needs analyze_diff and pr_comment but doesn’t need set_policy. A CI agent needs ci_gate and check_compliance but doesn’t need trend_report.
I defined 14 agent access profiles, each with a curated subset of the 54 tools:
- reviewer: diff analysis, scoring, PR comments
- auditor: full analysis, compliance checks, audit trails
- ci-bot: gate checks, SARIF export, GitHub status
- architect: coupling graphs, hotspot maps, trend reports
- refactorer: detection, scoring, comparison, before/after snapshots
- manager: trends, benchmarks, risk scores, dashboards
- security: policy enforcement, compliance, audit trails
- onboarding: basic analysis, explanations, coupling types reference
- contributor: file analysis, diff checks, suggested fixes
- maintainer: full analysis, policy management, exceptions
- compliance-officer: audit trails, SARIF, policy reports
- explorer: read-only analysis, metrics, no write operations
- admin: everything
- custom: user-defined tool subset
Each profile is a permissions boundary. When an agent connects with a specific profile, it only sees the tools assigned to that profile. The model’s context window only pays for the tools it can actually use.
This matters for token budgets. A reviewer agent loading 8 tools costs about 600 tokens in tool descriptions. Loading all 54 would cost 4,200. When you’re running multiple specialized agents, those savings compound.
Zero Configuration
The server installs from PyPI with pip install connascence. It registers as an MCP server with connascence mcp. No configuration files, no database setup, no API keys.
Point it at a directory and it analyzes. Set a policy and it enforces. Export to SARIF and your CI platform picks it up.
The zero-configuration design was deliberate. Every configuration option is a reason for someone to not finish setting it up. Defaults are opinionated: all nine connascence types enabled, severity thresholds set to reasonable values, output format is JSON. Override anything you want, but the defaults work.
Why 54 Tools Instead of 5
I could have built this as 5 tools: analyze, set-policy, check-compliance, export, and report. Everything else would be parameters on those five tools.
I tried that first. It was worse.
The problem is discoverability. When an AI model sees a tool called “analyze” with 30 parameters, it has to figure out which parameters to set for each use case. When it sees a tool called “analyze_diff” with 2 parameters (diff content and output format), it knows exactly when to use it and exactly what to pass.
Specific tools with narrow interfaces beat generic tools with broad parameter spaces. The model makes fewer mistakes, the user gets more predictable results, and the tool descriptions are clearer.
The 54-tool approach also enables the agent access profiles. You can’t give a reviewer access to “analyze with diff mode” but not “analyze with full mode” if they’re the same tool. Separate tools mean separate permissions.
What It Finds
Here’s what a typical run looks like on a real codebase. I ran the analyzer on a 30K-line Python web application:
- 47 instances of Connascence of Meaning (magic numbers and undocumented status codes)
- 23 instances of Connascence of Algorithm (duplicated business logic)
- 18 instances of Connascence of Position (functions with positional parameters that callers get wrong)
- 12 instances of Connascence of Timing (race conditions in async code)
- 8 instances of Connascence of Value (modules that must agree on specific values but don’t use a shared constant)
The top three hotspot files accounted for 40% of all coupling instances. The coupling graph showed a cluster of six modules with mutual Connascence of Algorithm — they all implemented the same price calculation differently.
The team fixed the price calculation cluster in one afternoon. The other 47 magic number instances went into a backlog ordered by risk score. Within a month, the overall coupling score dropped 31%.
That’s the value proposition: find the specific coupling patterns that matter, prioritize by risk, and measure the improvement.
Try It
Install from PyPI: pip install connascence
Run as MCP: connascence mcp
Analyze a directory: connascence analyze ./src
The source is open. The PyPI package is published. The MCP server works with any MCP-compatible AI assistant.
If your codebase has coupling problems — and it does, they all do — at least now you can name them.
I build code quality infrastructure that works inside AI workflows. The connascence analyzer, GuardSpine governance platform, and CodeGuard review system all connect through MCP. If you want to see what they find in your codebase, book a walkthrough: cal.com/davidyoussef